Population dynamics simulation
October 22nd, 2024 by Zen
I just took G’s numbers and did a crude simulation.
These are for US national and LDS numbers, where P0 is the childbearing population and P1 is the older non childbearing. Can you tell the difference?
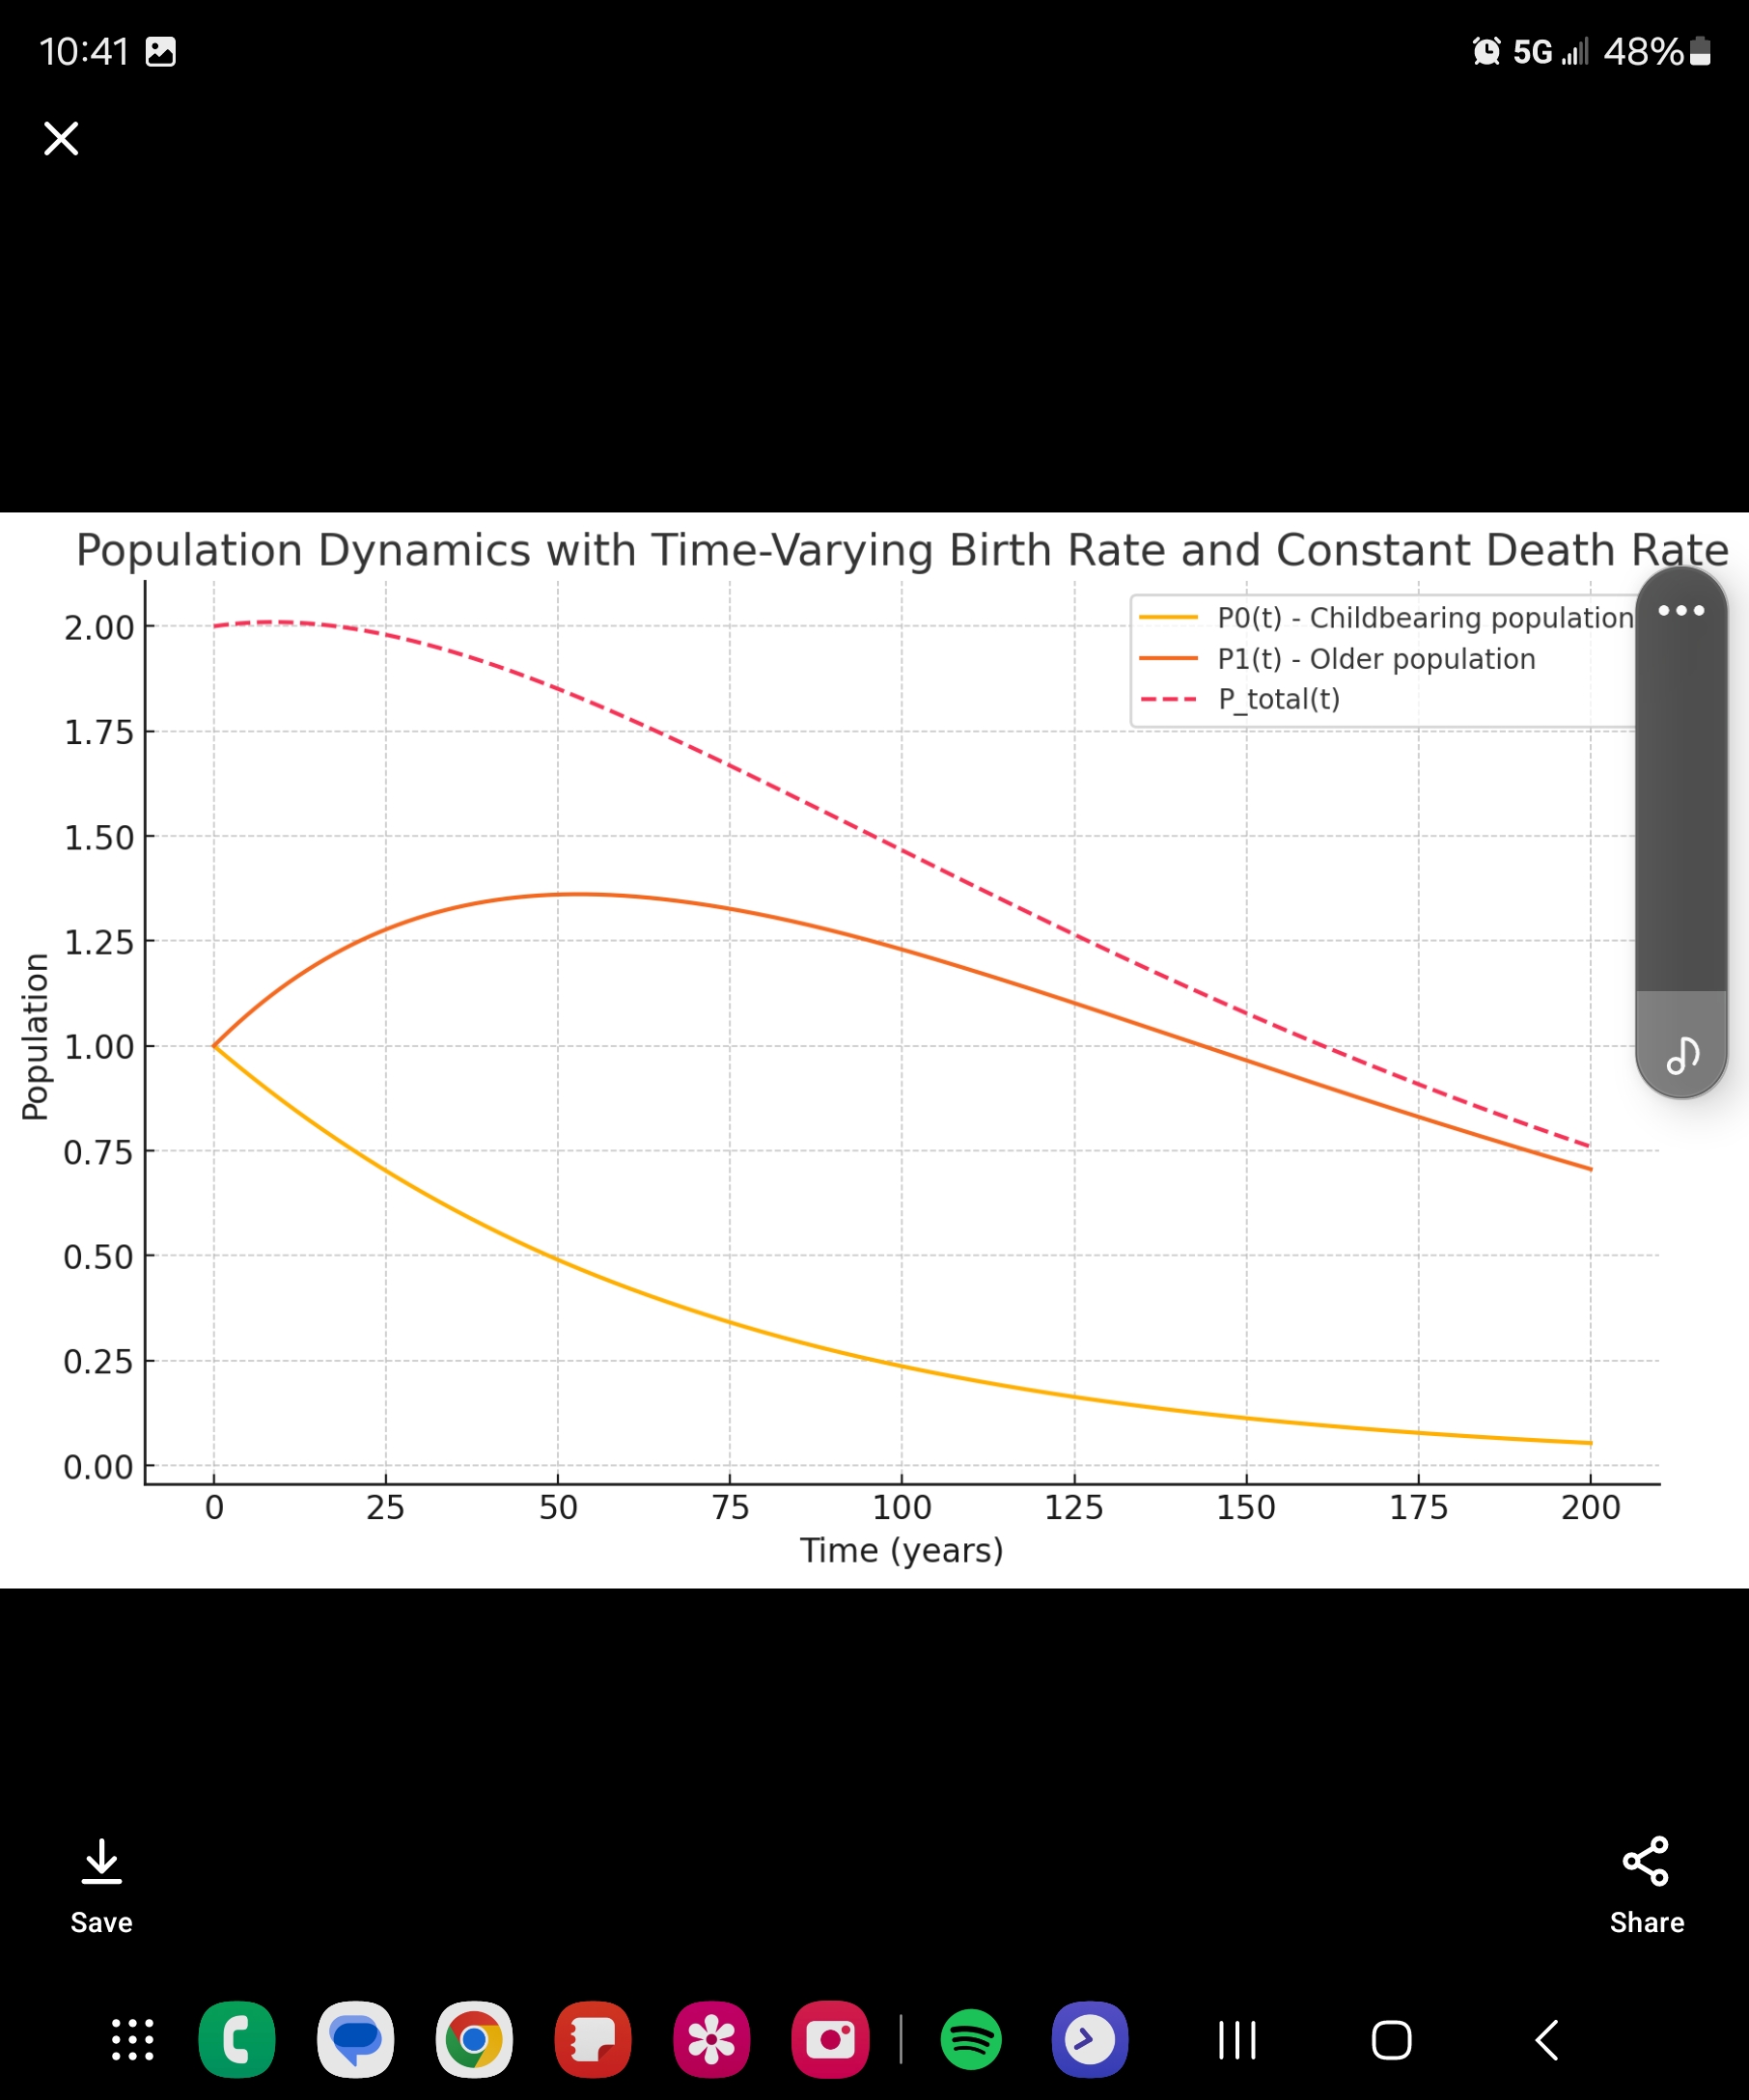
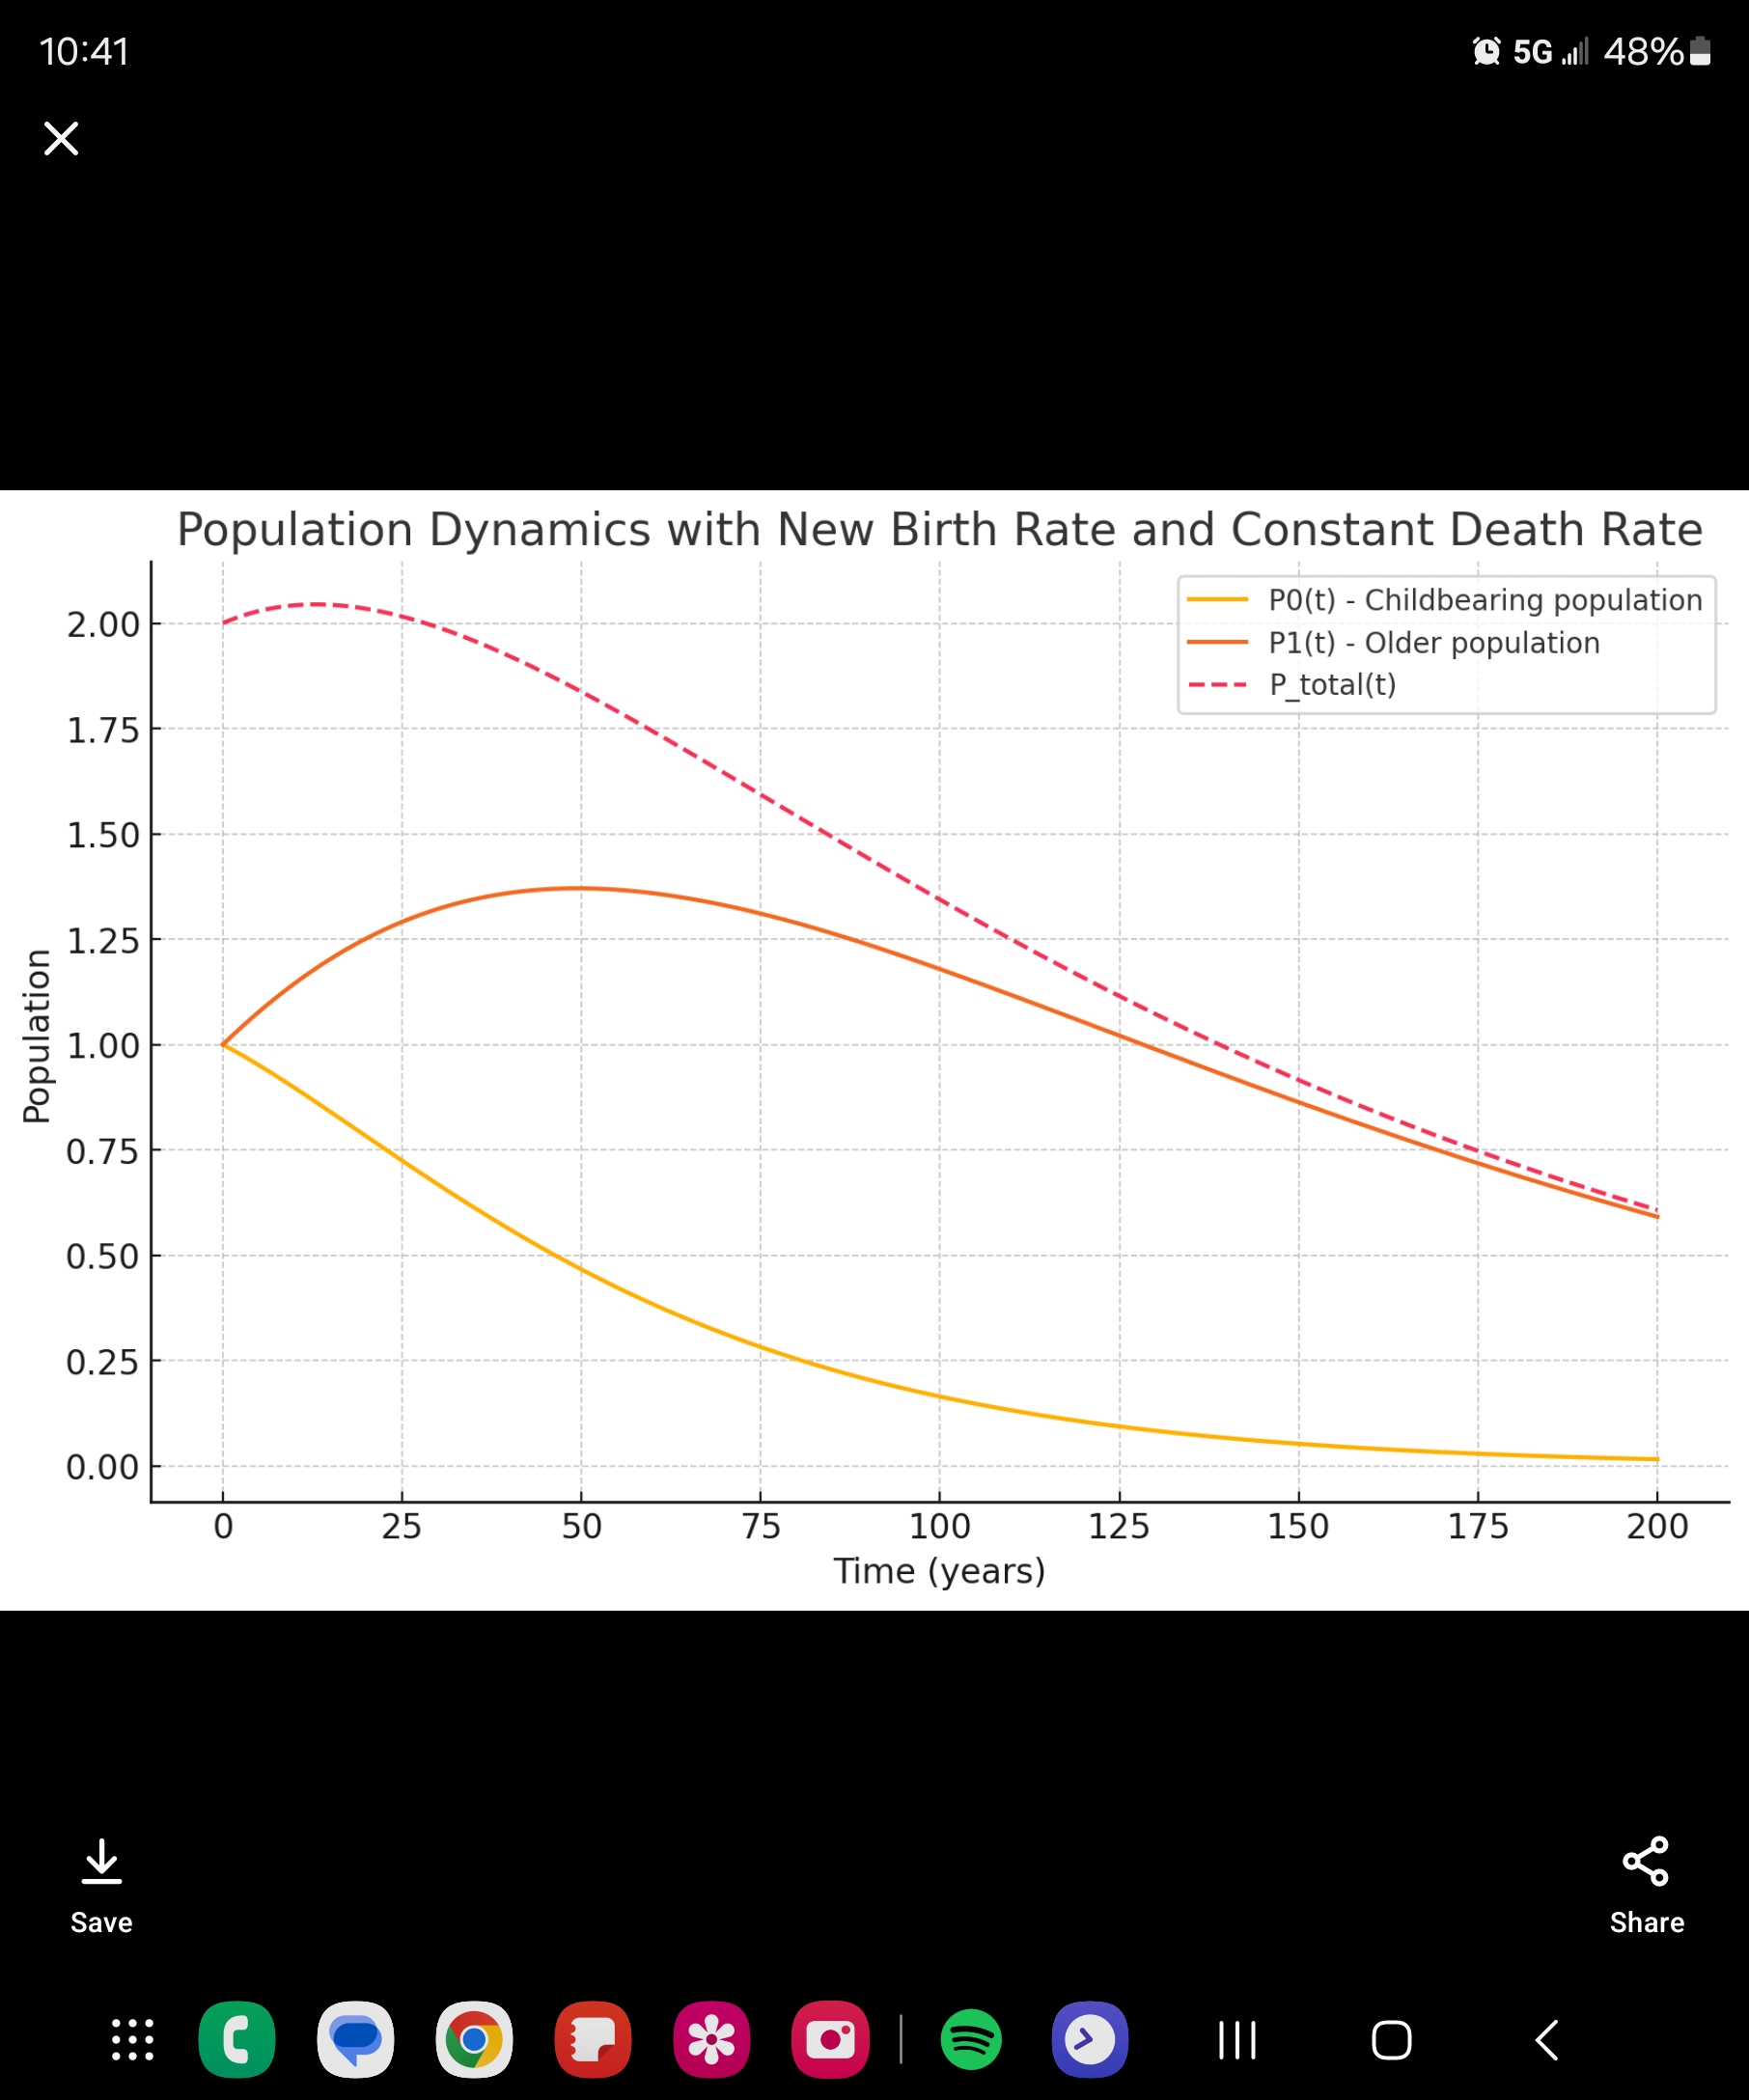
We are the one with the tiny bump. But both show a half life of childbearing population of about 50 years and a total population of roughly 150. Basically indistinguishable.
This is a crude simulation and I don’t promise there are no mistakes. Still, all is NOT well in Zion.
And just for fun, this is the ratio of childbearing vs non-childbearing populations.
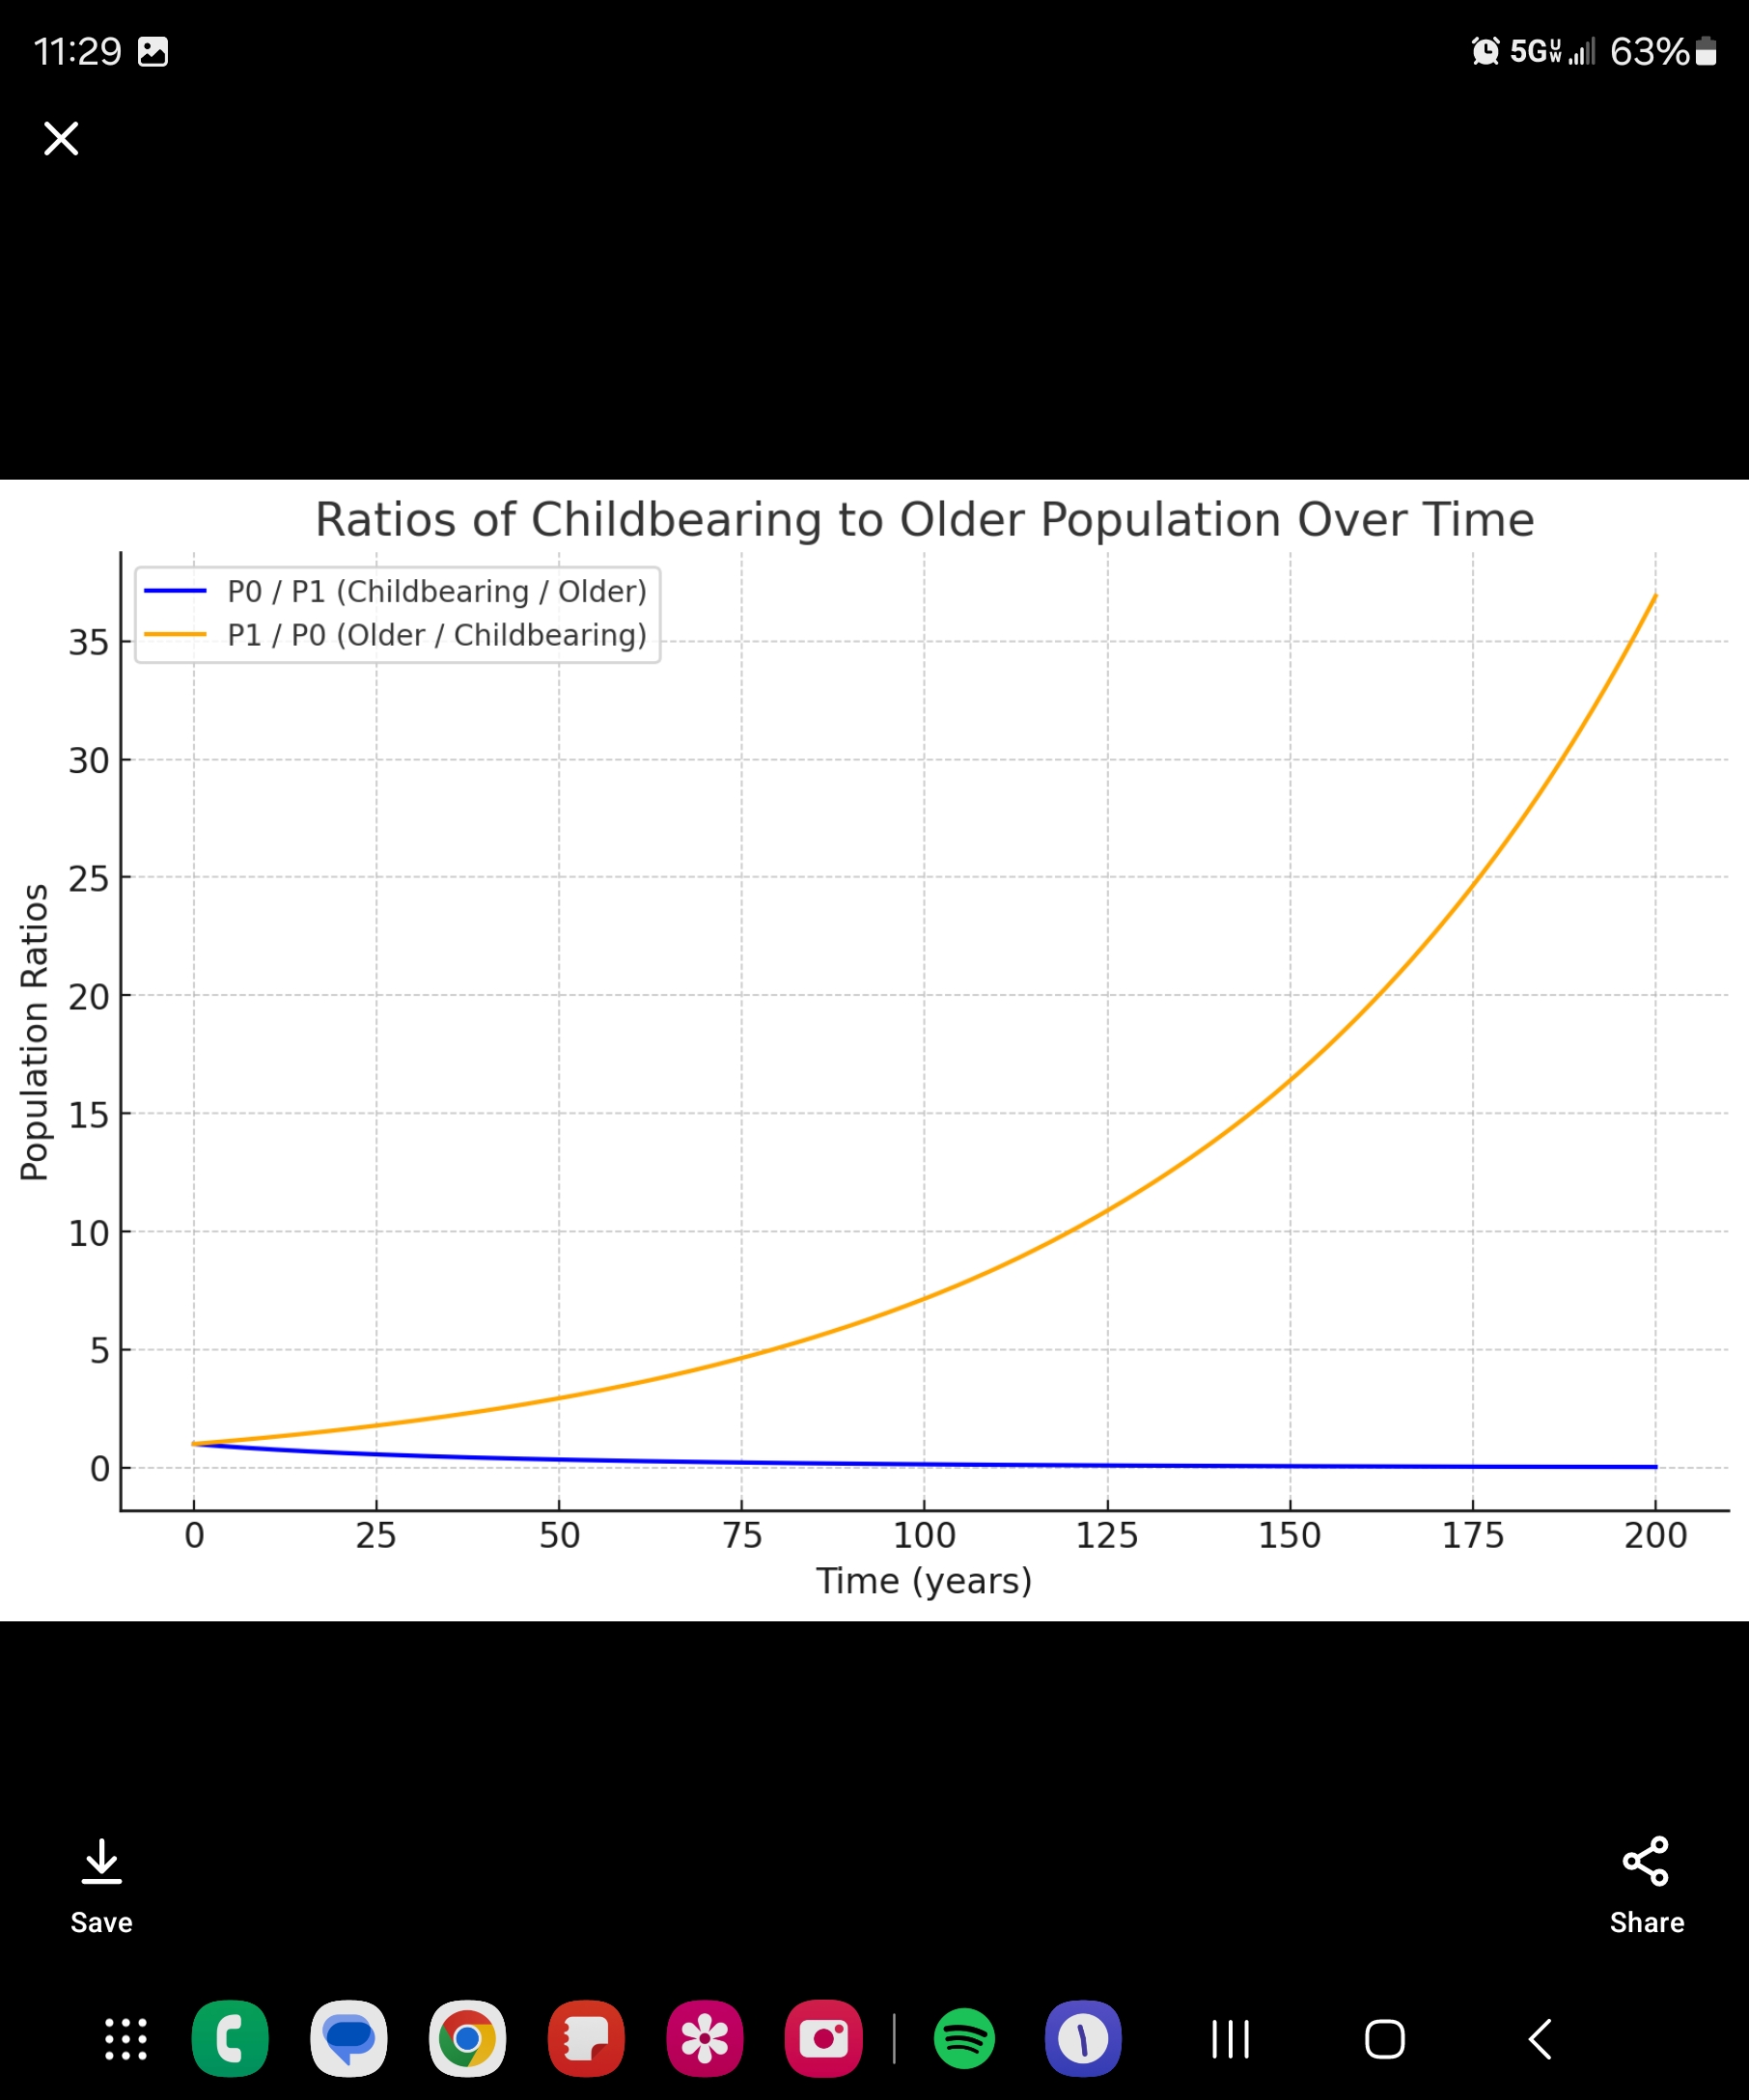
So, mostly old people.
Comments Off on Population dynamics simulation

Filed under: We transcend your bourgeois categories | No Tag
Filed under: We transcend your bourgeois categories | No Tag
October 22nd, 2024 08:51:27